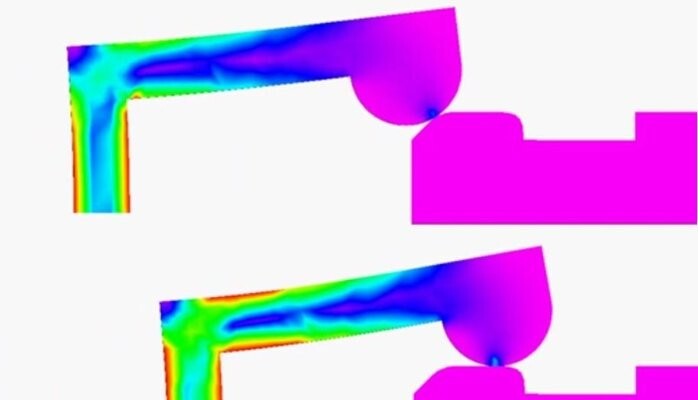
 To put it in one sentence, nonlinear Finite Element Analysis (FEA) results change with time or load at a rate that cannot be predicted by following the same path. Walk along a path at the same speed, in the same direction and it is easy to work out exactly what time you will reach your destination. You have followed a linear path, linear FEA is the same, it follows a straight line predictable path. Now walk along the same path with two small children in tow. One of them will probably stop somewhere along the path to inspect a worm. The other one will walk in a different direction towards the farmer’s field to stroke the friendly bull. It's somewhat harder to predict what time you will reach your destination. Just like nonlinear FEA, you have followed a nonlinear path. This is the primary reason nonlinear FEA is more expensive than linear FEA. It's just harder to predict how long it will take and how much it will cost, almost everything in the real world is nonlinear and doesn't follow the linear path. There are two main types of nonlinearities in FEA and they are due to geometry and material. Very flexible structures and loosely fitted components fall into geometric nonlinearities and parts that yield are dependent on material nonlinearities. Geometric Nonlinearity The fishing rod is a good example of geometric nonlinearity and is shown in figure 1. 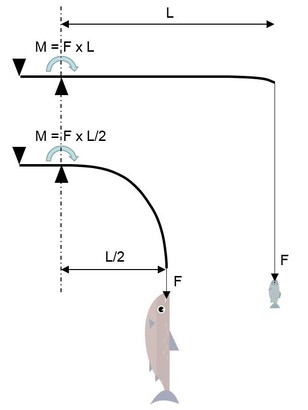 Figure 1 – Geometric Nonlinearity If the fishing rod has a small weight on it then the moment force required at the handle to lift the fish out of the water is force (fish weight) multiplied by the full length of the rod, not a problem for a tiddler. Now let's say you catch a whopper and the rod bends over double, the bending moment then becomes force multiplied by about half the rod length. Much easier on the fisherman or fisherwoman, there are a few! Any assembly of parts that slide, separate, peel, rock and roll are also very much nonlinear in the sense that load distribution changes as the contact surfaces move away or come into contact. The changing contact regions also affect stress and displacement. The FEA software deals with the changing contact regions by dividing the load into smaller chunks or time steps. It then solves the first time step and uses this as the basis for the next time step until all the time steps have been solved. You then end up with dozens or even hundreds of result sets, one for each time step. This enables you to track stress and displacement as it varies with time and load. To process all of these time steps in the nonlinear model takes longer than the simple linear model. So if you want it fast you should invest in a good workstation. Material Nonlinearity It's normal for engineering components made from steel to follow a linear path up until yield before becoming nonlinear. Since it is desirable to keep stress below yield then the linear model suits most applications. Sometimes you need to know what happens beyond yield, for example, the crush tube is designed to yield specifically for the purpose of reducing impact force. The rate of permanent deformation can only be found by conducting nonlinear FEA or testing. The stress-strain curve for steel illustrates this as shown in figure 2. 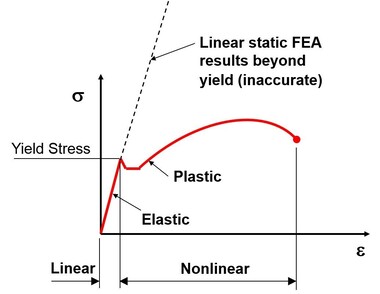 Figure 2 – Material Nonlinearity (Stress-Strain Curve for Steel) The stress and displacement is quite accurate up until yield in the linear FE Model but is nonsense beyond yield. The nonlinear FE Model on the other hand can predict accurate stress and displacement beyond yield.
There are other types of nonlinearities which are special cases including hyper elastic materials (rubber, silicone etc.), creep and buckling to determine the post collapse shape.
0 Comments
Your comment will be posted after it is approved.
Leave a Reply. |
AuthorChris Hall 
Categories
All
Archives
May 2023
|