- Value Design Ltd
- Services
- Projects
-
Finite Element Analysis
- Introduction to Basic FEA
- Units
- Co-ordinate Systems
- FEA Procedure
- Defining Objectives
- Stress Concentration
- Geometry import / clean up
- Meshing
- Material Properties
- Boundary Conditions
- Solvers
- Investigating FEA Results
- Reporting
- Stress Theories
- Cantilever Beam Worked Example
- Pressure Vessel Worked Example
- Shaft in Torsion Worked Example
- Buckling Worked Example
- Bearing (Contact) Worked Example
- Non Linear Material Worked Example
- Portal Frame Worked Example
- BLOG
- FAQ
- CONTACT
Non linear FEA (material) - Worked Example
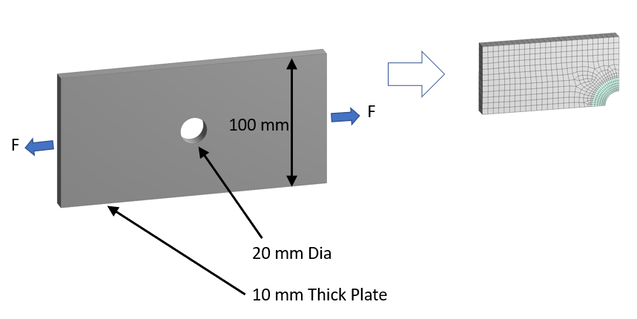
Consider a steel plate 100 mm wide x 10 mm thick with a 20 mm diameter hole in the centre. An FEA model of the plate was built using symmetry and the model was meshed using hexahedral elements as shown in figure 1.
Figure 1 – FEM of Plate with Hole in Tension using Symmetry
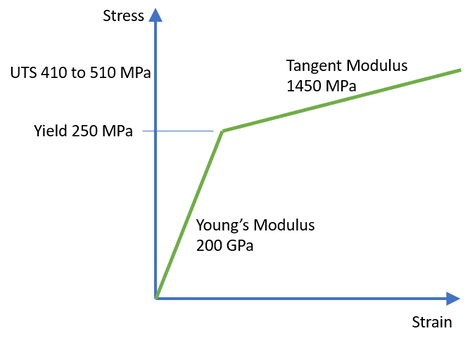
Bilinear Isotropic Hardening material properties was assigned to the model as shown in figure 2.
Figure 2 – Bilinear Material Properties
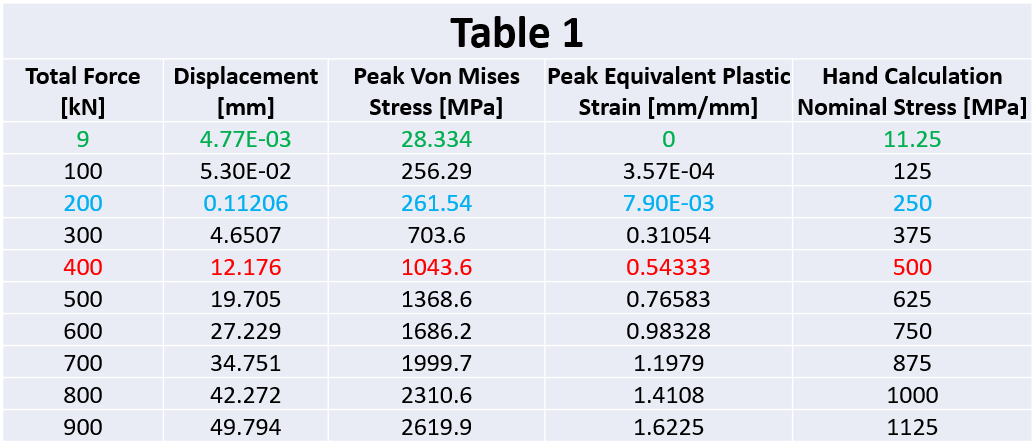
The model was constrained for symmetry and the load applied at the plate end starting at 9 KN and then in increments of 100 KN to 900 KN. The stress and displacement results were then tabulated in Table 1.
Tip
The bilinear material model is very good but if you need to be more accurate, use true stress and strain.
Tip
The bilinear material model is very good but if you need to be more accurate, use true stress and strain.
A hand calculation was done to check the nominal stress for each of the applied loads in Table 1. The first one at 9 KN is the same as the stress concentration example in another part of the FEA Tutorial and the nominal stress was 11.25 MPa.
From the hand calculation, you would expect that the component starts to yield significantly at 200 KN because the nominal stress has reached yield which is 250 MPa.
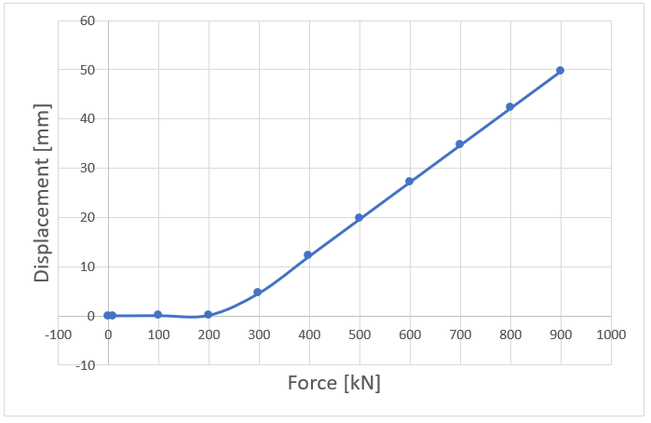
Enough of the hand calculations, now let’s look at a graph of FEA displacement in figure 3.
From the hand calculation, you would expect that the component starts to yield significantly at 200 KN because the nominal stress has reached yield which is 250 MPa.
Enough of the hand calculations, now let’s look at a graph of FEA displacement in figure 3.
Figure 3 – FEA Model Force vs Displacement
You can see from the graph that was created by the FEM that the displacement really takes off at 200 KN because the nominal stress across the section has reached yield. You would not observe this with linear material properties.
Tip
The bilinear material model does not tell you when the component will actually fracture. I very much doubt that this component will stretch by 50 mm in length, it would fracture well before that in reality.
If we assume that the elongation of the steel is 20%, this means a 100 mm long tensile test bar would stretch by 20 mm before it fractures. If we were to assume that the tensile test piece length is 20 mm (hole diameter) then, 20% of 20 mm is 4 mm. So as a guess, I would say the plate with the hole could fracture when the plate length is stretched by about 4 mm. Referring back to Table 1, it can be observed that at 300 KN, the total displacement is 4.6 mm. The hand calculated nominal stress at 300 KN was 370 MPa which is well above yield but below UTS.
We can observe from the hand calculation that the nominal stress reaches 500 MPa with a load of 400 KN. It’s likely that the component will fracture with this load since the engineering nominal stress is above Ultimate Tensile Strength which ranges from 410 to 510 MPa.
Based on the results, the plate will probably fracture between 300 and 400 KN.
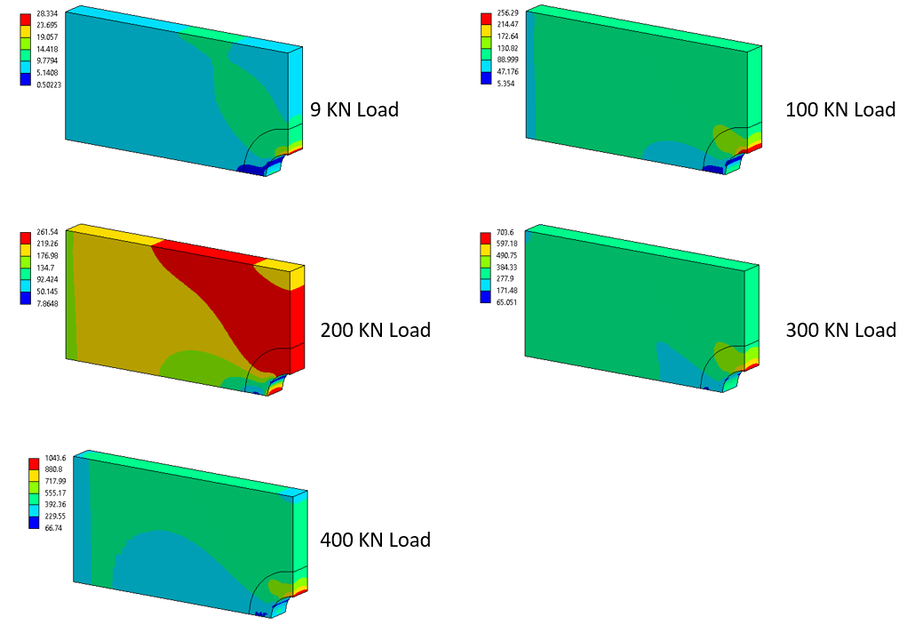
Now let’s have a look at some von Mises stress plots up to 400 KN load in figures 4 & 5.
Figure 4 – FEA Model von Mises Stress
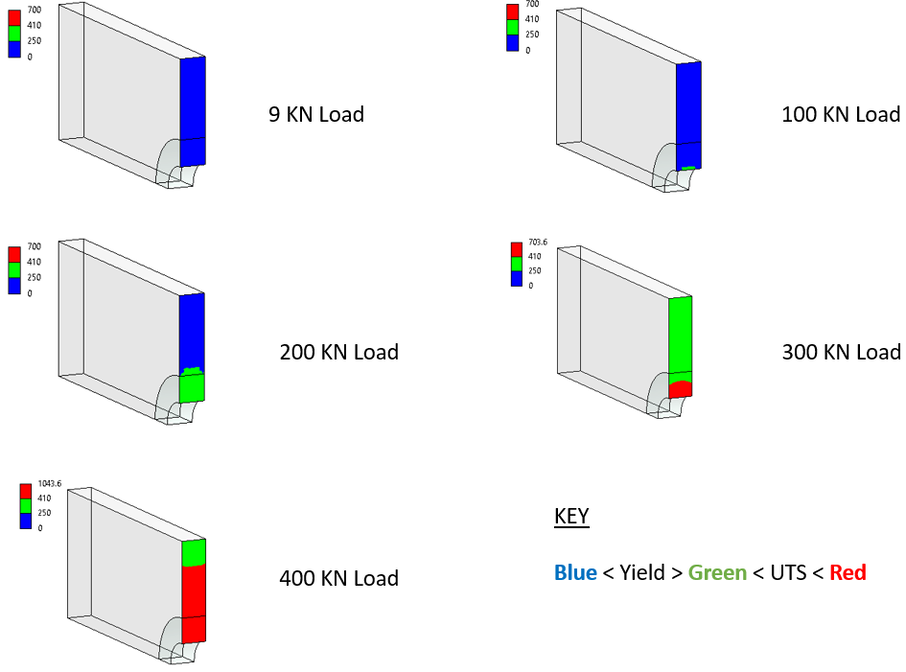
Here are a few stress plots through the cross section. Blue is below yield, green is above yield but below UTS and red is above UTS.
Figure 5 – FEA Model von Mises Stress through Cross Section
You can see from the pictures in figure 5 that;
Tip
There is significant scatter in tensile test pieces and the range in UTS was 410 to 510 MPa. In reality, there may be an even wider range. Also, the bilinear material model is approximate and the stress keeps going up and up above UTS which can't happen in reality with engineering stress - strain. That's because the bilinear material model is basically two linear lines rather than following the true stress-strain curve. So if you need to be more accurate, you can use the actual true stress – strain curve.
As with all nonlinear analysis, since we creating a model that is closer to reality, the margin of error in the model increases with complexity. This is because there is a lot more opportunities to get it wrong and the model could be sensitive to the input data you are using.
In summary, if we were to run a physical tensile test, my money would be on the plate fracturing between 300 and 400KN. If my life depended on it, I would demand to see actual stress-strain curves for a number of test samples and I would input this data into the model as a true stress-strain curve. That said, the bilinear material model is my favourite because it's simple and quick.
- At 200 KN load, about a third of the cross section is yielding. The nominal (average stress) from the hand calculation is exactly at yield at 250 MPa. This load will not fracture the plate.
- At 300 KN load, the entire cross section is yielding, about 15% is above UTS and the rest above yield. The nominal stress from the hand calculation was 375 MPa which is quite close to the lower bound UTS of 410 MPa. You will see the significant deformation under this load and possibly fracture in some test samples.
- At 400 KN load, about 75% of the cross section is above UTS, the rest is above yield. From the hand calculation the nominal stress was 500 MPa. I would expect this plate to fracture under this load.
Tip
There is significant scatter in tensile test pieces and the range in UTS was 410 to 510 MPa. In reality, there may be an even wider range. Also, the bilinear material model is approximate and the stress keeps going up and up above UTS which can't happen in reality with engineering stress - strain. That's because the bilinear material model is basically two linear lines rather than following the true stress-strain curve. So if you need to be more accurate, you can use the actual true stress – strain curve.
As with all nonlinear analysis, since we creating a model that is closer to reality, the margin of error in the model increases with complexity. This is because there is a lot more opportunities to get it wrong and the model could be sensitive to the input data you are using.
In summary, if we were to run a physical tensile test, my money would be on the plate fracturing between 300 and 400KN. If my life depended on it, I would demand to see actual stress-strain curves for a number of test samples and I would input this data into the model as a true stress-strain curve. That said, the bilinear material model is my favourite because it's simple and quick.
- Value Design Ltd
- Services
- Projects
-
Finite Element Analysis
- Introduction to Basic FEA
- Units
- Co-ordinate Systems
- FEA Procedure
- Defining Objectives
- Stress Concentration
- Geometry import / clean up
- Meshing
- Material Properties
- Boundary Conditions
- Solvers
- Investigating FEA Results
- Reporting
- Stress Theories
- Cantilever Beam Worked Example
- Pressure Vessel Worked Example
- Shaft in Torsion Worked Example
- Buckling Worked Example
- Bearing (Contact) Worked Example
- Non Linear Material Worked Example
- Portal Frame Worked Example
- BLOG
- FAQ
- CONTACT

